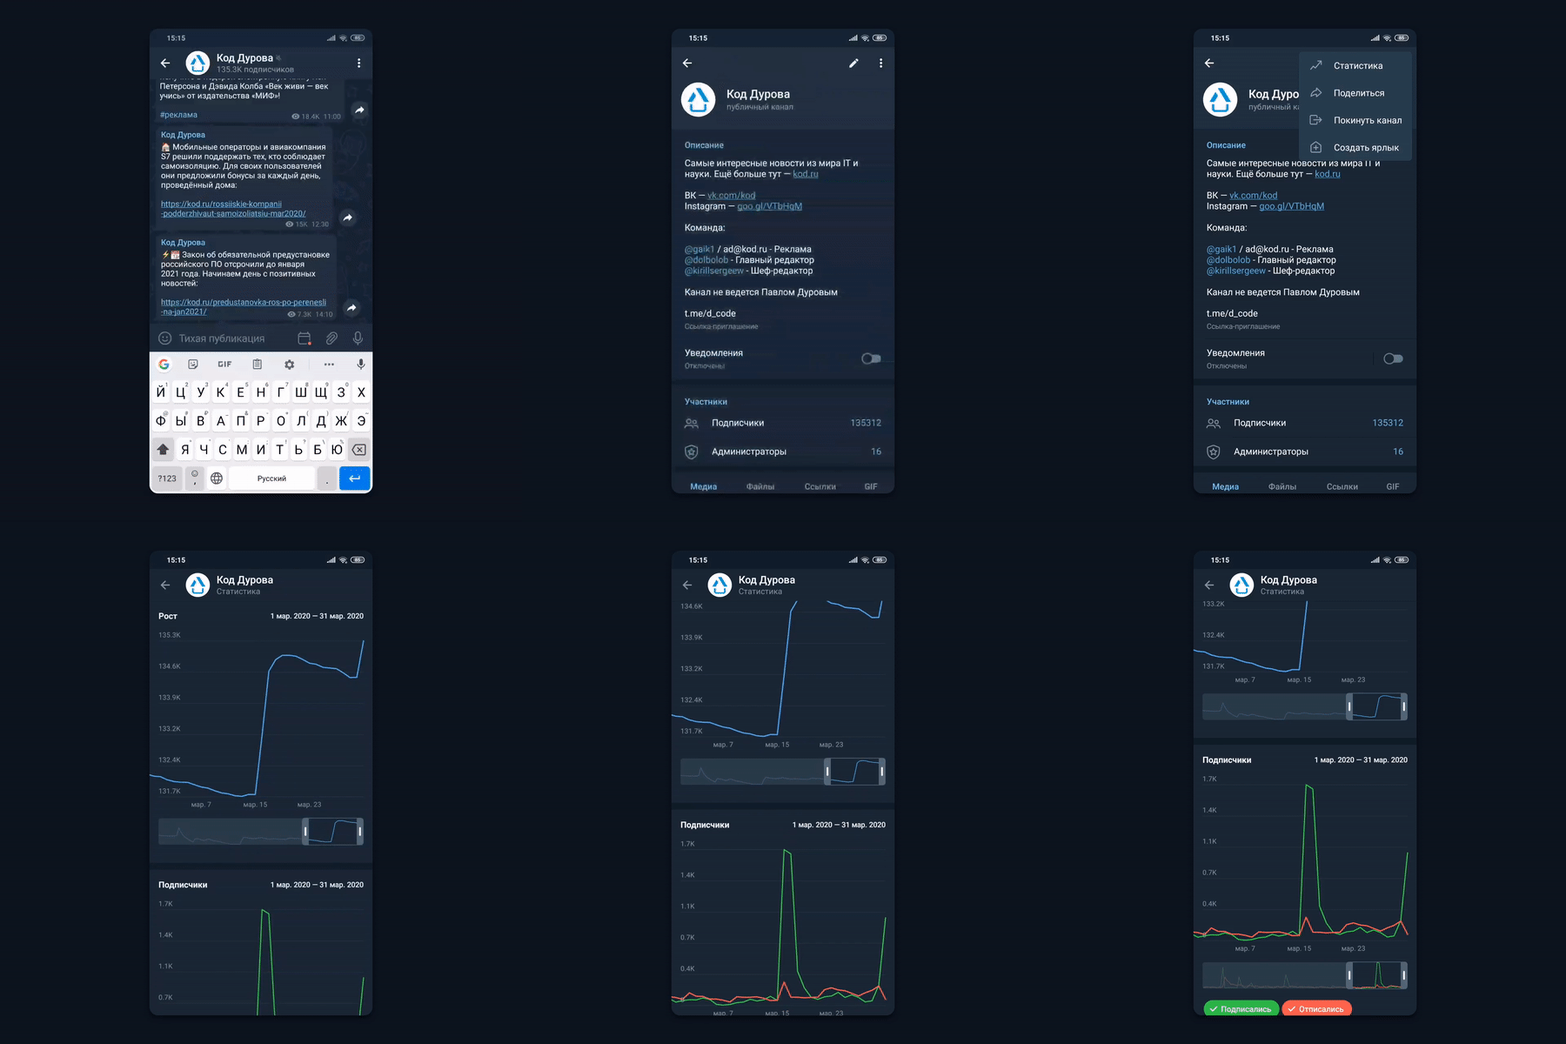
After several years of waiting, channel statistics appeared on Telegram. Now administrators can track the activity of their audience. Today, “Telegram Info” together with the “Code of Durov” channel prepared a material with a detailed story about the new section.
Important: in order to view statistics, the administrator must have the right to publish messages to the channel. At the same time, the channel itself should have more than 1,000 subscribers.
Due to the specific location of the statistics opening button, some users may not immediately find a new section.
Android

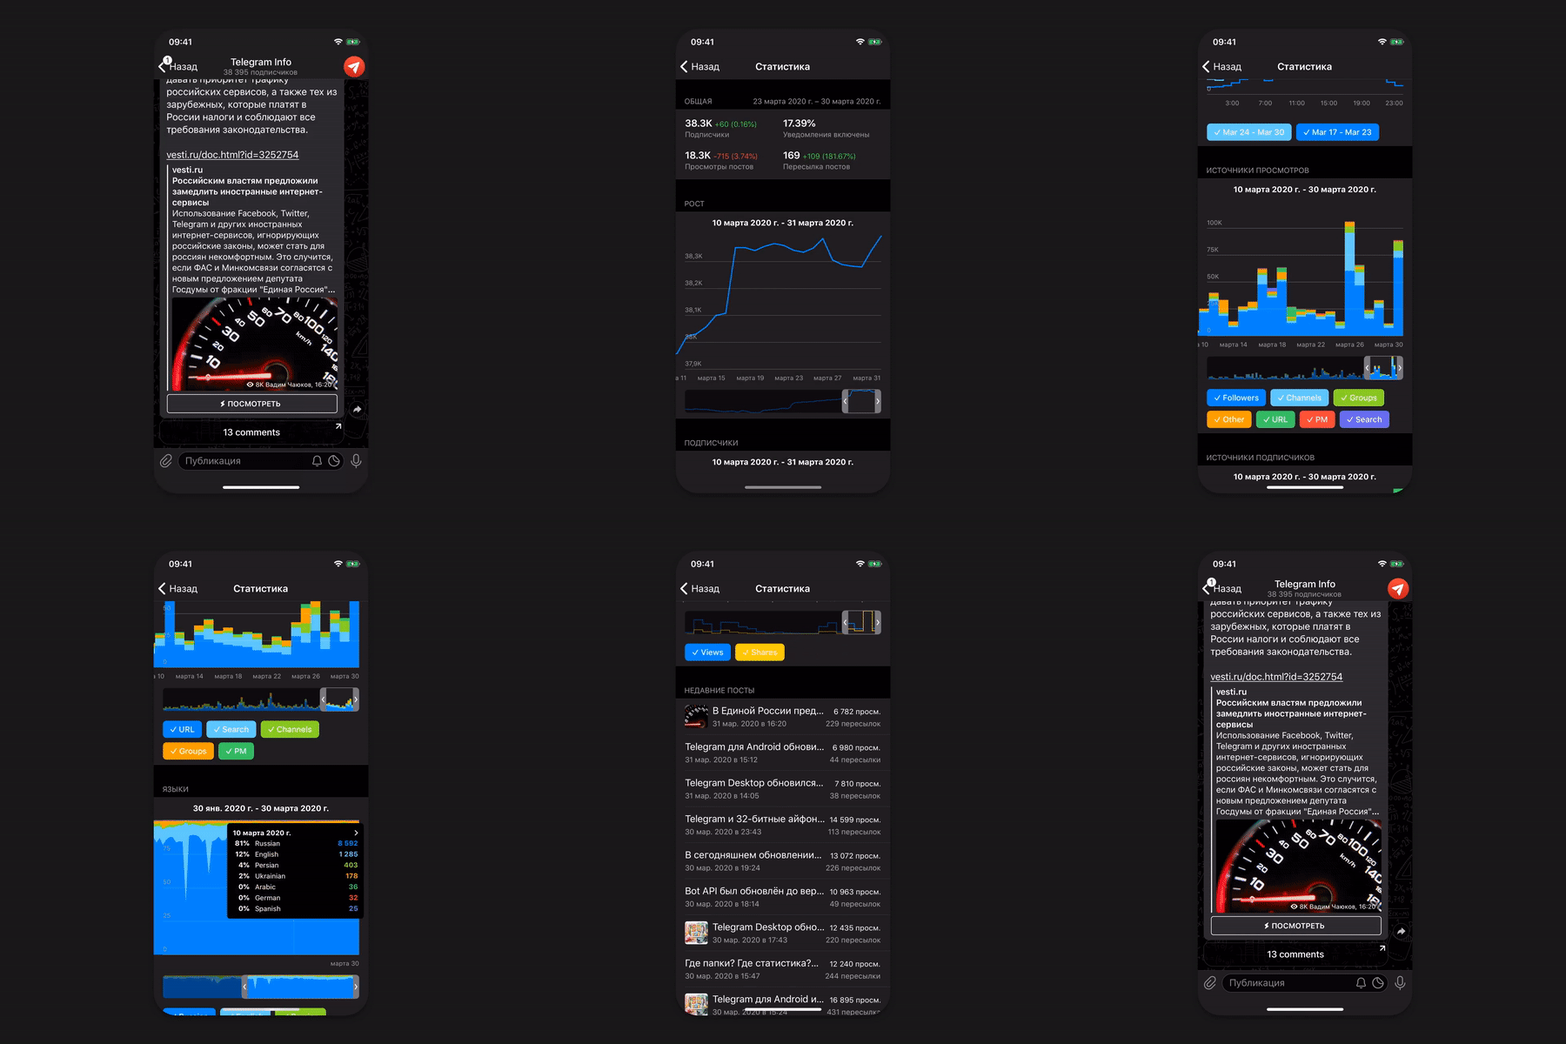
iOS

At first glance, the statistics look rather complicated and incomprehensible, but this is not so. We see a fairly intuitive and simple interface, framed by pleasant animation. Let’s analyze the features of each block of statistics.
Summary Statistics
Unlike the Android client, the iOS application in the upper block shows summary statistics for the last 7 days. This block cannot be configured — you cannot change periods or see details. It includes the following items:
- Followers
- Percentage of Notifications Included
- Post Views
- Post Forwarding

In future versions of Telegram for Android, this information will no longer be exclusive to iOS users. The same block of summary statistics can be found in the desktop version for macOS, but the version for Windows, unfortunately, did not receive channel statistics at all.
Рост

Shows the dynamics of changes in channel subscribers. The custom slider at the bottom will help you choose the time frame you are interested in. The minimum interval is 10 days. The maximum possible is about three months.
It is likely that statistics will not be provided for an earlier period. By moving your finger on the chart you can see specific numbers for the day you are interested in.
Подписчики
The dynamics of the subscribed and unsubscribed subscribers per day.

You can choose one of two graphs, or display two items at once simultaneously.
Notifications
The number of subscribers who turned on or off notifications on a given day. According to the schedule, you can see after which publications subscribers turned off notifications from the channel.

You probably have to change the approach to channel maintenance, or simply not pay attention to these numbers.
Watch Views
Graphics on iOS and Android are implemented in a different style. On Android, these are smooth lines, on iOS, the graph is made in the form of a ladder.

Here we have two graphs — this is the last week and the previous one, so you can safely compare the performance of publications.
View Sources
This section shows all the possible places where posts published per day were viewed.

This block displays the following viewing sources:
- subscribers: views from people who are subscribed to the channel;
- channels: views from posting publications to other channels;
- groups: views from people who communicate in groups;
- URL: views from people who clicked to publish;
- personal chats: views from people who have forwarded the publication from the channel;
- search: views of the publication from people as a result of search on the channel.
Sources of new subscribers
In this block, information is displayed identically to the section with view sources.

Only the available tags differ: URLs, search, channels, groups and private chats.
Localization
The language installed on Telegram (and on the device) for users who view publications. If posts were shared in other channels and chats, all this will be reflected in the diagram.

To see the usual schedule for recent months, you must click the “Zoom out” button. Here you can see detailed information by day. Just drag your finger along the schedule. To return to the chart view, click on the pop-up statistics.
Using the slider, you can change the period for which you want to see the distribution of localizations: from a week to one day. You can enable or disable the display of languages on the chart. If languages are excluded, the percentage of the chart will be incorrect.
Activity
The dynamics of views and the number of reposts of publications. By default, audience activity over the past 7 days is shown.

In general, you can view data for the last 22 days. The period of activity can be changed using the slider.
Activity IV (Instant View)
The diagram is absolutely identical to the previous block, however in this case the number of views and transfers directly from the Instant View pages is shown.

Recent Posts
List with publication statistics for the last 7 days. You can see the specific number of views and shipments.

The appearance of statistics in Telegram marks a new milestone in the development of the messenger. It is increasingly moving away from the classic concept of a messenger and is turning into a multidisciplinary application. This is confirmed by the simultaneous appearance in the release of tabs for different types of chats. Telegram has long been not just a messenger, but now its separation from the classic means of exchanging messages between people has become even greater.
Subscribe to our channels in Telegram to always be aware of the latest Telegram and TON news.